Feed on
Posts
Comments

von Sarah Labusga, Anna-Lena Scharfenberg, Marcel Reinmuth

Dieser Blogpost dokumentiert, wie mithilfe von Hochwassermarken und Fragebögen die Ausdehnung des Hochwassers 1993 in Eberbach auf einer Onlinekarte visualisiert werden kann.

Im Rahmen des interdisziplinären Geländepraktikums „Disaster Risk Mapping“ wurden mit unterschiedlichen Apps Daten zum Thema Hochwasser in Eberbach erfasst. Die für unsere Analyse relevanten Daten wurden mit der mobilen App KoBoCollect erfasst. KoBoCollect bietet die Möglichkeit auf mobilen Geräten Geodaten zu sammeln. Für unsere Fragestellung wurde die App so eingerichtet, dass wir Hochwassermarken erfassen und Fragebögen ausfüllen lassen konnten. Die Besonderheit hierbei ist, dass die Geoposition mit GPS erfasst und abgespeichert wird. Außerdem können die Daten als .csv-Datei exportiert und damit recht einfach mit Excel, ArcGIS und QGIS prozessiert werden.

Datensätze

Zu den Hochwassermarken wurden jeweils der Standort, das Jahr und die Höhe der Hochwassermarke über dem Gehweg aufgenommen. Zudem konnte ein Foto der Hochwassermarke angehängt werden. Die Ergebnisse des Fragebogens enthielten ebenfalls eine Spalte mit Werten zur Hochwassertiefe am Standort der Befragung. Die Befragten waren aufgefordert, anzugeben, wie hoch das Hochwasser 1993 an der entsprechenden Stelle gewesen ist, sollte diese betroffen gewesen sein.
Die Werte zur Hochwassertiefe stellen die Grundlage der Online-Karte dar.

Prozessierung der Daten

Nachdem die Datensätze soweit vorbereitet worden waren, dass sie weitereditiert werden konnten, wurden die Hochwassermarken zum Jahr 1993 gefiltert und extrahiert. Aus den Befragungen wurden ebenfalls die Einträge extrahiert, welche Hochwasserwerte für 1993 enthalten. Das Zusammenführen der Tabellen ergab unseren Datensatz. Da dieser jedoch nur eine sehr begrenzte Anzahl an Einträgen lieferte, musste ein Ansatz gefunden werden, wie er erweitert werden konnte. Ziel für die Online-Karte war die Darstellung der Hochwasserausdehnung repräsentiert durch eine Fläche. Unser Lösungsansatz war daher eine Erhöhung der Punktanzahl, die eine Hochwasserinformation beinhalten, um eine möglichst wahrheitsgetreue Fläche darstellen zu können.
Die Vorgehensweise war wie folgt:

  1. Erzeugung von Punkten mit einem realen Hochwasserpegel durch händisches Eintragen des Pegelstandes im Neckar (RÖCKEL, D. (1995): Der Neckar und seine Hochwasser am Beispiel von Eberbach. Krauth: Eberbach. 160 S.) Dies ergab einen erweiterten Datensatz.
    Abbildung 1
    Abbildung 1: Rot: Erhobene Daten; Gelb: manuell gesetzte Punkte anhand des Pegels im Neckar
  2. Um aus einem Datensatz, der Punkte enthält, eine Fläche zu erzeugen, können diese interpoliert werden. Die Interpolation erstellt ein Raster. Aufgrund der begrenzten Anzahl der Eingabepunkte, war dieses allerdings sehr grob und nicht anschaulich. Das Problem sollte gelöst werden, indem der Datensatz um weitere Punkte ergänzt wurde und zwar durch eine Berechnung dieser.
  3. Mit dem Focal-Statistics-Tool wurden die erhobenen Punkte zunächst als Raster kreisförmig erweitert. Hiermit wurden Werte für Standorte erzeugt, an denen wir keine Daten hatten erheben können. In diesen neuen Punkten wird der Wert des Ursprungspunktes gespeichert.
  4. Mit dem „Extract by Points“-Tool wurden in einem identischen Punkt-Layer die Höhenwerte des Ursprungspunktes aus einem ASTER GDEM in die erzeugten Punkte gespeichert. Auch dieser Layer wurde in das Rasterformat konvertiert und kreisförmig erweitert.
  5. Mit Hilfe des Rastercalculators wurde nun auf der Grundlage von Hochwassertiefe und Geländehöhe im Ursprungspunkt die Hochwassertiefe in den erweiterten Punkten mit der örtlichen Geländehöhe berechnet. Formel:(Hochwasserwerte/100)-(Hoehenmodell Eberbach -Hoehenwerte)
    Abbildung 2
    Abbildung 2: Schwarz: Erhobene Daten und manuell gesetzte Puntke; Grün: Berechnete Daten
  6. Nach einer Konvertierung des Rasters zu Punkten, konnte die IDW (inverse distance weighting) angewandt werden, die durch Interpolation den Punktdatensatz für eine bestimmte Fläche erweitert. Dies ergab aus einem Datensatz mit ursprünglich 56 Punkten, eine Fläche, die auf 490 Punkten basiert und in ein viel genaueres Raster konvertiert werden kann.

Ergebnis

Aufgrund des Höhenmodells mit einer Genauigkeit von 30m waren die Angaben zur Berechnung der zusätzlichen Punkte leider sehr ungenau. Beispielsweise erhielten Punkte, die im Bereich der Altstadt liegen, negative Hochwasserwerte. Das Höhenmodell beinhaltet in diesem Bereich unrealistische Höhenunterschiede bis 8 Meter. Die Darstellung der Fläche war somit ebenfalls fehlerhaft. Schlussendlich gilt für die Lösung dieser Ungenauigkeit, dass mit einem höher aufgelösten Höhenmodell mehr Werte berechnet werden könnten. Leider ist es bisher kaum möglich ein solches Höhenmodell von Eberbach zu erlangen.
Die Visualisierung der Ergebnisse ist auf dieser uMap zu sehen.

von Olivia Franz, Laura Schäflein, Valmire Tmava

Untersuchungsgebiet Eberbach

Eberbach liegt östlich von Heidelberg im Neckartal. Der Fluss führt hier Wasser aus einem Einzugsgebiet von 12.700 Quadratkilometer mit sich. Steile Ufer und wenig durchlässige Bodenschichten im Zuflussgebiet des Neckars tragen dazu bei, dass auftretender Nieder-schlag schnell abgeführt werden kann und somit die Entstehung von Hochwasser begünstigt. Im Jahr 1834 ereignete sich in Eberbach eines der größten Hochwasserereignisse. Wegen heftiger Niederschläge stieg der Wasserpegel am 30.Oktober auf eine Höhe von 11,94 Meter. Ebenso das Hochwasser von 1993 mit einem Wasserpegel von 9,26 Meter  ist den Be-wohnern Eberbachs bis heute in Erinnerung geblieben.

Aufgabenstellung und Datenerfassung

Im Zuge des interdisziplinären Geländepraktikums im Bereich Katastrophenmanagement DisasterRiskMapping und Risikobewusstsein sollen Daten hinsichtlich der kritischen Infra-strukturen in Eberbach erfasst, bewertet und schließlich in einer Online-Karte visualisiert werden. Benötigte Daten werden mit Hilfe von fieldpapers sowie den Apps KoboCollect, Vespucci und Geopaparazzi im Gelände aufgenommen und schließlich in der Nacharbeitung mittels OSM und dem Bearbeitungsprogramm QGIS aufbereitet. Hierbei wurden Messungs-ungenauigkeiten ausgeglichen, Daten digitalisiert und Fotografien den jeweiligen Standort zugeordnet. Daten, die für die Bearbeitung der Aufgabenstellung benötigt werden sind: (1) Hochwassergefahrenkarten, (2) Kritische Infrastrukturen, (3) Schutzvorrichtungen an Ge-bäuden und Objekten.

Datenaufbereitung und Risikobewertung

Alle erforderlichen Daten wurden als shapefile-Dateiformat abgespeichert und können in Esri ArcGIS bearbeitet werden. Da die Daten der kritischen Infrastrukturen ausschließlich als Punkte erfasst wurden und nicht als Polygone, werden zunächst alle Gebäude Eberbachs aus overpass-turbo.eu übernommen und entsprechend ihrer Relevanz selektiert. Bezüglich der Aufgabenstellung wurden folgende Gebäude selektiert und hinzugefügt: townhall, social_facility, school, police, place_of_worship, nursing_home, pharmacy, kindergarten, emergency_service, doctors, bank, hotel, hospital. Polygone und Punkte werden schließlich miteinander abgeglichen und gleichnamige Punkte entfernt. Garageneinfahrten, Hausein-gänge und Stromverteiler werden weiterhin als Punkte dargestellt. Da nicht alle Stromverteiler Eberbachs im Gelände erfasst wurden, werden auch hier die benötigten Daten aus overpass-turbo.eu übernommen und hinzugefügt.
Für die kritischen Objekte und Gebäude im gefährdeten Gebiet soll nun eine Risikobewertung erstellt werden. Die Bewertung erfolgt unter Betrachtung verschiedener Hochwasserge-fahrenkarten, vorhandener Schutzvorrichtungen und ob es sich bei dem gefährdeten Objekt generell um eine kritische Infrastruktur handelt. Hierbei erhalten kritische Infrastrukturen den Wert 1. Den Hochwassergebieten werden folgende Werte zugeordnet: HQ10= 4, HQ50= 3, HQ100= 2, HQextrem= 1. Hierbei gilt je höher die Eintrittswahrscheinlichkeit eines Hochwas-serereignisses ist, desto höher ist das Gefährdungsrisiko. Objekte und Gebäude, die eine Schutzvorrichtung besitzen, erhalten zusätzlich den Wert -1. Um Objekte und Gebäude im jeweiligen Hochwassergebiet verorten zu können, werden die Hochwassergefahrenkarten als shapefile in Esri ArcGIS übernommen und mit den kritischen Infrastrukturen abgeglichen. In der table of contents werden neue Spalten generiert, in denen die jeweiligen Werte einge-tragen werden. Mit Hilfe des field calculators wird die Risikobewertung schließlich wie folgt berechnet:

Risikobewertung= [Kritische Infrastruktur]+[Hochwassergebiet]+[Schutzvorrichtung]
Die Risikobewertung der Kritischen Infrastrukturen umfasst somit eine Skala von Null (ge-ringfügig gefährdet) bis Fünf (hohes Gefährdungsrisiko).

Erstellen einer Online-Karte in uMap

Alle aufbereiteten Daten bzw. die kritischen Infrastrukturen (Punkte und Polygone) werden in QGIS als geojson-Dateiformat gespeichert und können nun in uMap importiert werden. Die Daten werden in verschiedene Ebenen importiert, um individuell bearbeitet werden zu kön-nen. Die Beschreibung enthält den Namen des Objekts, die Risikobewertung und die Infor-mation darüber, ob eine Schutzvorrichtung vorhanden ist oder nicht. Zusätzlich wird ein Foto des jeweiligen Objekts in die Beschreibung mit eingebunden (Abb.1).
Abbildung 1
Abbildung 1: Beschreibung der kritischen Infrastrukturen
Um die Verteilung der weniger gefährdeten Kritischen Infrastrukturen und der Kritischen Infrastrukturen mit hohem Gefährdungsrisiko darzustellen werden die Kritischen Infrastrukturen mit dem Wert 0 bis 2 in einer hellrosa Farbe dargestellt, die Kritischen Infrastrukturen mit dem Wert 3 bis 5 in dunkel-roter Farbe (Abb.2).
Abbildung 2
Abbildung 2: Verteilungsmuster
Eine weitere Funktion der Karte ist die up-to-date-map. Hierbei werden die Apotheken Eber-bachs mit OSM verknüpft, sodass eine Änderung der Apotheken in OSM ebenso eine Ände-rung in der online-Karte zur Folge hat. Dementsprechend müssen Apotheken aus overpass-turbo.eu exportiert, die Link-Adresse angepasst und schließlich in Umap eingefügt werden.

Ergebnis

Das Ergebnis findet sich auf dieser uMap.

von Sabine Meurer, Alicia Rehberger, Kristina Waschkowski

Bei der Benutzung von „Volunteered Geographic Information“ (VGI) müssen auch die Limitierungen dieser Art von Informationen betrachtet werden. Eine ist die GPS-Genauigkeit, d.h. die räumliche Präzision. Diese stellt nach wie vor eine große Herausforderung in der aktuellen Forschung dar, da Ungenauigkeiten zu falschen Schlussfolgerungen führen können. Gleichzeitig gibt es jedoch in diesem Bereich noch ungenügend Ergebnisse, um konkrete Aussagen über die Standortgenauigkeit von Punkten und Ähnlichem in VGI zu treffen. Ein Versuch wurde bereits von HAKLEY unternommen, der die Positionsgenauigkeit von OSM mit kommerziellen Daten (OS Meridian 2) für Großbritannien verglich. Weitere Forschungsprojekte untersuchten die räumliche Genauigkeit mit OSM oder auch die Vollständigkeit dieses Systems mit Tele Atlas. Oft wird mit der Gi-Statistik gearbeitet, um Gebiete mit hohen und niedrigen Genauigkeiten festzustellen. Räumliche Heterogenität spielt eine Rolle und generell hat sich OSM als passende Alternative erwiesen, jedoch müssen noch mehr Fallbeispiele (wie diese) folgen, um mit Überzeugung OSM als gleichgestelltes Datennetz anzuerkennen (HELBICH et al. 2010).

Datenaufbereitung

Zunächst müssen die Daten aus der KoBoCollect und VespucciApp in ein GIS eingepflegt werden. Die Rohdaten werden anschließend mit Hilfe einer Hintergrundkarte korrigiert (hier: OSM). Dieser Schritt ist nötig, da die GPS-Genauigkeit bei der Aufnahme der Daten stark schwanken kann. Bei den hier verwendeten Apps wurden null Meter als geringste Abweichung realisiert. Höhere Werte können bis zu über 30 Meter Ungenauigkeit variieren. Die Korrektur selbst wird per Hand und unter Zuhilfenahme der Fieldpapers vorgenommen. Die Fieldpapers wurden vorab im Untersuchungsgeiet (Eberbach) erstellt. Dabei wird per Hand der Standort eines Punktes in eine Karte eingetragen. Im Rahmen des Geländepraktikums „Katastrophenmanagement – Disaster Risk Mapping und Risikobewusstsein“ wurde die kritische Infrastruktur (z.B. durch Hochwasser gefährdete Gebäude/Einrichtungen wie Kindergärten), Hochwassermarken von vergangenen Hochwasserereignissen und Schutzmaßnahmen getaggt. Zu den Schutzmaßnahmen zählen unter anderem höher gebaute Eingänge, wasserdicht verschließbare Tore vor Einfahrten und einiges mehr. Nachdem die Punkte an ihre reale Stelle verschoben wurden, konnte mit diesen ein neuer Datensatz angelegt werden (korrigierte Daten). Anschließend wurden die Rohdaten sowie die korrigierten Daten in eine Karte eingetragen. Hierbei werden diese jeweils in das Koordinatensystem ETRS 1989 UTM 32 N projiziert. Dieser Schritt ist nötig um in der Distanzanalyse Ergebnisse im metrischen System zu generieren. Die Analyse erfolgt anschließend mit den Rohdaten und den korrigierten Punkten.

Datenanalyse & Ergebnisauswertung

Um die Analyseschritte schneller bearbeiten zu können, wird ein „Workflow“ (Abb. 1) erstellt. Zu Beginn werden die Rohdaten und die korrigierten Shape-Dateien (Kritische Infrastruktur, Schutzeinrichtungen, Hochwassermarken) mit einem „Join“ verbunden. Im nächsten Schritt der Analyse wird die Distanz der einzelnen korrigierten Punkte zu ihren Rohdaten gemessen. Als Ergebnis liegt die durchschnittliche Abweichung der Schutzvorrichtungen bei 10,25 m, der Hochwassermarken bei 11,44 m und der Kritischen Infrastruktur bei 9,38 m (siehe Tab. 1). Dies zeigt, dass die GPS-Genauigkeit der OSM-Daten nicht mit der Realität übereinstimmt. Im Falle einer Gefahrensituation jedoch kann dies zu Problemen z.B. bei der Evakuierung führen. Des Weiteren gibt die Tabelle darüber Aufschluss, dass auch Daten mit deutlich höheren Abweichungen aufgenommen wurden (bis 108,39 Meter). Dieser Ausschlag ist jedoch ein Einzelfall und kann daher vernachlässigt werden. Werte in dem Bereich zwischen 30 m und 35 m treten häufiger auf. Hierbei wird vermutet, dass die Präzision mit dem Zeitaufwand zusammenhängt. Diese These wird dadurch gestützt, dass die GPS-Genauigkeit verbessert werden kann, umso häufiger das Tagging an einem Ort durchgeführt wird.

Abbildung 1
Abbildung 1: Workflow Distanzanalyse ArcGis

Tabelle 1: Auswertung der Distanzberechnungen

Schutzvorrichtung Hochwassermarken Kritische Infrastruktur .
104 51 77 Anzahl der Punkte
0 0,05 0 Minimale Abweichung
35,55 36,69 108,39 Maximale Abweichung
10,25 11,44 9,38 Durchschnittliche Abweichung

Die analysierten Daten wurden im letzten Schritt in die Online-Karte „uMap“ eingeladen. Hierfür müssen sie in dem Datenformat .geojosn, sowie dem Koordinatensystem WGS 1984 vorliegen. In der webbasierten Karte können nun die Distanzabweichungen der korrigierten Daten zu den Rohdaten in Meter abgelesen werden. Des Weiteren werden die jeweils zugehörigen Fotos und Namen angezeigt. Die erstellte Online-Karte ist unter dem Link zu finden.

Auswertung der Fragebögen über die KoBoCollect-App

KoBoCollect ist eine App, die Funktionen bereitstellt, mit welchen digitale Daten gesammelt und Umfragen erstellt werden können. Im Rahmen des Geländepraktikums wurde die App verwendet, um Befragungen bei der Bevölkerung im Untersuchungsgebiet durchzuführen und Hochwassermarken und Schutzvorrichtungen zu taggen. Bei den Befragungen ging es unter anderem um das historische Hochwasserereignis 1993 am Neckar in Eberbach, dessen Auswirkungen auf Gebäude und die Reaktionen der Bevölkerung.

Um Vor- bzw. Nachteile der Nutzung herauszufiltern, wurde ein Fragebogen erstellt (siehe Abb. 2). Im Folgenden werden die Resultate dargestellt.
Abbildung 2
Abbildung 2: Fragebogen zur Evaluierung von KoBoCollect

In der Summe wurden acht Fragebögen ausgefüllt. Sechs davon befanden, dass die Nutzung der App auch ohne Vorwissen möglich sei. Die verständliche Bedienung von KoBoCollect wurde unter anderem mit Kommentaren wie „selbsterklärend“ oder „gewöhnlicher Fragebogen nur mit digitalen Eingabefunktionen, prinzipiell nichts Neues“ beschrieben. Für die Untersuchung der Hochwassergebiete ist die App für ¾ der Befragten ausreichend. Weitere wünschenswerte Funktionen sind, dass mehr Informationen erfasst werden können und dass es eine größere Auswahl von zusätzlichen Antwortmöglichkeiten gibt. Dies könnte mit einer ausführlicheren Befragung eventuell gelöst werden. Zur Frage, ob ein schriftlicher Fragebogen der App vorgezogen wird, gibt es keine eindeutige Antwort (50% der Befragten präferieren einen schriftlichen Fragebogen, 50% die App). Argumente für einen schriftlichen Fragebogen sind die erleichterte Kommunikation mit den Befragten, da nicht jede Antwort mühsam eingetippt werden muss. Außerdem müsste nicht zwischen Tablet und Papier gewechselt werden, sobald etwas in die Karte eingezeichnet wird oder Notizen protokolliert werden. In der Nachbereitung der Daten hat der digitale Fragebogen klare Vorteile, da die Daten direkt in das System eingeladen werden können. Zusätzliche Funktionen, wie die GPS-Ortung und die Foto-Option, können die Daten um ein weiteres aussagekräftiger machen. Ein Nachteil der App liegt in der Vorarbeit aufgrund der Komplexität bei der Erstellung des Fragebogens. Abschließend wird die App von 7 Befragten mit der Note 2 (gut) und einmal mit der Note 3 (befriedigend) bewertet (Bewertungsmaßstab Noten 1-6).

Literatur:

M. HELBICH, C. AMELUNXEN, P. NEIS, A. ZIPF (2010): Investigations on Locational Accuracy of Volunteered Geographic Information Using OpenStreetMap Data. Online unter: http://web.ornl.gov/sci/gist/workshops/2010/papers/Helbich.pdf (zuletzt abgerufen am 02.12.14)

von Robin Hintzen, Yan Zhou, Marius Zipf

Das Hochwasser im Jahr 1993 in Eberbach ist dem Großteil der Anwohner als ‚historisches Jahrhunderthochwasser‘ in Erinnerung geblieben. Im Rahmen des Geländepraktikums „Katastrophenmanagement: Disaster Risk Mapping und Risikobewusstsein“ wurden verschiedene Daten zu Hochwasserschutzvorrichtungen, Pegelständen, persönlichen Erfahrungen usw. mithilfe von jedermann zugänglichen Werkzeugen (kostenfreie Apps) und direkten Befragungen erhoben. Im Fokus der hier behandelten Fragestellung ist das Potenzial von nutzergenerierten Informationen zur Rekonstruktion der Überflutungsfläche während des genannten Hochwasserereignisses.

Die Rekonstruktion basiert ausschließlich auf den Informationen, welche durch Interviews mit den Bewohnern Eberbachs vor Ort gewonnen werden konnten. Die wichtigsten Kriterien bilden die genaue Position des Wohnsitzes der Befragten und die aus der Erinnerung der Anwohner heraus gezeichnete Ausdehnung des Hochwassers im Jahre 1993 („Mental Map“). Insgesamt konnten auf diese Weise aus 37 Befragungen individuelle Überflutungskarten ermittelt werden, welche die Grundlage der Analyse darstellen. Hierbei wurden zwei verschiedene Ansätze verfolgt, welche im Folgenden vorgestellt werden.

Ansatz 1

Die Verknüpfung aller individuellen Überflutungsflächen resultiert in einer potentiellen Gesamtüberflutungsfläche, welche aus den Mental Maps rückgeschlossen werden kann. Unter der Annahme, dass die Aussagekraft des ermittelten Überflutungsgebietes umso höher ist, je mehr Mental Maps sich überschneiden, wurden Wahrscheinlichkeitsabstufungen hinsichtlich der Wahrheitstreue der Aussagen eingeführt. Zu diesem Zweck wurden die individuell gezeichneten Überflutungsflächen miteinander überlagert und in Klassen eingeteilt. Um absolute Wahrscheinlichkeitsaussagen in Form von prozentualen Werten zu vermeiden, wurden relative Angaben (‚sehr hohe‘ bis ‚sehr geringe‘ Wahrscheinlichkeit) gewählt. Stadtbereiche mit 35 – 37 sich überschneidenden Mental Maps (Klasse A) spiegeln somit beispielsweise eine mit sehr hoher Wahrscheinlichkeit überflutete Fläche wider.

Ansatz 2

Eine zweite Methode zur Rekonstruktion der Hochwasserfläche bietet die Einbindung des Wohnstandortes. Davon ausgehend, dass sich die Anwohner in unmittelbarer Umgebung um ihren Wohnsitz besser auskennen als weiter davon entfernt, können erneut Wahrscheinlichkeitsabstufungen in Bezug auf die Aussagekraft der Befragten konstruiert werden. Dazu werden Buffer mit einem Radius von 200m um die Wohnstandorte gezogen. Die Überschneidungsfläche von jedem Buffer mit der jeweiligen dazugehörenden Mental Map des dort Befragten bilden letztlich wahrscheinlich überflutete Flächen. Auch hieraus ergeben sich für alle 37 Interviewten Überflutungsflächen (sogenannte „Plausibilitätsflächen“), welche ebenfalls miteinander überlagert und klassifiziert werden. Nach demselben Prinzip wie im ersten Ansatz resultiert eine Karte mit Stadtbereichen, wo sich viele bzw. wenige Plausibilitätsflächen überlappen, welche mit hoher bzw. geringer Wahrscheinlichkeit überflutete Gebiete kennzeichnen.

Ergebnisse

Beide Ansätze führen zu Ergebnissen, mit welchen mehr oder weniger unterschiedliche Aussagen getroffen werden können. Es fällt auf, dass die Gesamtüberflutungsfläche identisch bleibt, da sie in beiden Fällen durch die Gesamtheit der individuellen Mental Maps begrenzt wird. Das Zentrum der mit hoher Wahrscheinlichkeit überfluteten Stadtgebiete verlagert sich jedoch stark. Im ersten Ansatz resultieren parallel zum Neckar verlaufende horizontal gestreckte Klassenflächen, welche sich halbkreisförmig nach Norden ausdehnen. Die Fläche mit der höchsten Überflutungswahrscheinlichkeit befindet sich unmittelbar am Flusslauf, wohingegen diese im zweiten Ansatz in die Stadtmitte rückt. Die Klassenflächen stellen hier eine eher kreisförmige Geometrie dar, welche sich mit abnehmender Wahrscheinlichkeit etwa konzentrisch vom Zentrum ausdehnen.

Um die Ergebnisse annäherungsweise mit der realen Überflutungsausdehnung vergleichen zu können, werden sie in der Abschlusskarte mit der offiziellen Hochwassergefahrenkarte des LUBW für ein Jahrhunderthochwasser abgebildet.

Kritik & Fazit

Die Ergebnisse sind insofern kritisch zu beurteilen, da im Laufe der Prozessierung Entscheidungen getroffen werden mussten, welche starken Einfluss auf das Endergebnis nehmen.

Zum Zwecke besserer Vergleichbarkeit wurde in beiden Ansätzen dieselbe Klassenanzahl gewählt, dessen Unterteilung und Klassenbreiten jedoch subjektiv bestimmt wurden. Genauso ist die sichere Aussagekraft bezüglich der Plausibilitätsflächen willkürlich auf einen Radius von 200m geschätzt worden, obwohl das Erinnerungsvermögen der Befragten ohne Zweifel über diesen Umkreis hinausgeht. Darüber hinaus lassen sich bei einer kleinen Stichprobengröße von 37 Befragungen keine verallgemeinernden Aussagen treffen. Bereits einige Befragungen mehr oder weniger sowie die zufällige Auswahl anderer Interviewteilnehmer hätten einen nachhaltigen Einfluss auf die Geometrie der Ergebnisflächen haben können.

Alles in allem lässt sich jedoch festhalten, dass nutzergenerierte Daten ein Potenzial beherbergen, dass zur Rekonstruktion von Überflutungsflächen mit konkreter räumlicher Ausdehnung führen kann. Der visuelle Vergleich zwischen den hier vorgestellten Ergebnissen und der Hochwassergefahrenkarte der LUBW verdeutlicht diese Schlussfolgerung.

By Yan Zhou

Start of thinking…

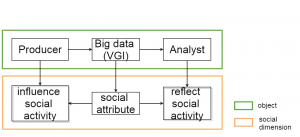
Social dimension towards data objects

Figure 1: Social dimension towards data objects

To understand the social dimension of VGI as “big data”, it’s necessary to consider the main objects of data: data producer, data self and data analyst. So that we can translate the corresponding social dimension of each object to more comprehensible respects: How the process of producing “big data” influences human’s social activities and on the other hand, how can social activities be reflected through “big data”?

But first of all, what is “big data”? According to the widely recognized definition, big data is characterized by 4Vs: volume(large amounts of data), variety(range of data types and sources), velocity(speed of data transfer) and value(the process of discovering huge hidden values from large datasets with various types and rapid generation) (Berman 2013; Gantz, Reinsel 2011). Volunteered geographic information (VGI), just as we have known from previous blogs, can be regarded as “big data”, which has become a popular word in disaster risk management (DRM).

Producing “big data” as social activity

For experienced mappers, Geographic information systems (GIS) plays an increasingly important role of producing VGI since the popularity of online mapping sites like OpenStreetMap. One example of DRM with online mapping is the “Missing Maps” project. It attracts international and local communities, NGOs and individuals to participate in collective mapping activity through organizing “mapping parties”. Volunteers from varies of occupations and countries get together and map for one purpose, which promote the communication and interaction of people with same interest. GIS is becoming part of mass media and functions as a tool for sharing and communicating knowledge (Sui, Goodchild 2011).

However, this chance for sharing and communicating knowledge is not equal for everyone. The level of using online GIS and participation are mostly determined by individual technical skills. Considering this problem, “Missing maps” project provides two approaches for mappers: experienced mappers are recommended using JOSM to edit data while beginners mapping with ID. In terms of the potentials and limits of democratization in such participation, Haklay(2013) has introduced a hierarchy of hacking, which demonstrated the ability to employ a given system. The first level “meaning hacking”, describes participants who make no change to system, like most of the volunteers in DRM who just find and collect information from web maps and photos. In the second level of “use hacking”, participants have technical skills to reuse some of the functionality of GIS and create new knowledge. What we can achieve in DRM at this level, for instance, is to map previous disaster experiences by tagging positions and adding information on a shared risk map. In the third level “sallow technical hacking”, systems are reconfigured to provide a new function. This requires people to obtain the ability of scripting and integrating information from multiple systems, like the Google Maps mashup at Scipionus.com as a response to the Hurricane Katrina disaster (Miller 2006). The final level is “deep technical hacking”, in which new systems will be created like OpenStreetMap, which allow the production of free geographic information that is accessible to anyone and for any purpose. Significant technical knowledge is required in this level, which are only available to a small group of technical elite. Yet, so far we have only considered people who have access to Internet, those who without internet are excluded and marginalized. In general, these people live in poor environment and thus are more danger in disaster. How to involve them as VGI producer, so that quicker and expresser assistance could be provided, remains to be a big challenge.

When comes to the willingness of sharing “big data”, a remarkable argument concerned with ways how VGI data are collected has arisen. We probably have the similar experience: we are required to accept providing location data compulsive in the contract of installing apps in smart phone. Otherwise we have to give up the installation. What is worse, the locational data will be continually recorded unless people turn off their phones, since even disable location services did not stop sending location data (Sui, Elwood 2013). Are these data still volunteered? Based on this fact, researchers have distinguished crowd sourced locational data into two types according to the origin of data. Data collected with the knowledge and explicit decision as well as purposes can be classified as volunteered geographic information (VGI), while those collected without knowledge, purpose and notice belong to contributed geographic information (CGI) (Sui, Elwood 2013). Besides privacy issue, the significance of differentiating VGI and CGI lies more in the possibility to recognize data quality and suitability of analysis regarding DRM.

Benefits and challenges of “big data”

We believe, at least have supposed that, the bigger the data is, the more we can benefit from them. The study of Hurricane Sandy may show us huge benefits from geo-referenced “big data” from tweeter(Shelton et al. 2014). From the whole scale of United States, the distribution of Sandy-related tweets shows a significant concentration in places that were most affected by the storm. And also the density of data from affected areas is corresponding with financial losses towards storm. Furthermore, the analysis within New York City has indicated the correlation between wealthy and tweeting activity. Places with significant damage but relatively little tweeting have captured our attention to the difference of social activity between central locations and periphery area. Under certain scales, different results and discoveries can be concluded from the same data. More social knowledge that encoded in disaster related data can be mined from varies of aspects.

However, can “big data” truly reflect social activity? Is that possible that too “big” volume of data from areas with high density of population can cause the problem of misleadingness and overreaction in DRM? It’s not always better to be “big”, regardless of validity and reliability (Metaxas et al. 2014) On the other hand, the so called “big data” seems to be “small” and not enough to cover all the disaster related people. The diversity and completeness of using disaster related “big data” is also a big challenge for researchers. Future study of DRM with geo-referenced data should be extended beyond the simple mapping and tagging, and also focus on comparing and combining with other data sources, connecting social and spatial processes such as social networks (Crampton et al. 2013) Moreover, more robust data analysis and synthesis methods for studying spatial dynamics in DRM are needed(Sui, Goodchild 2011), which also reminds us to think about additional knowledge and skills that are required in GIScience for DRM.

References

Berman, Jules (2013): Principles of Big Data. Preparing, Sharing, and Analyzing Complex Information: Elsevier.

Crampton, J. W.; Graham, M.; Poorthuis, A.; Shelton, T.; Stephens, M.; Wilson, M. W.; Zook, M. (2013): Beyond the geotag: situating ‘big data’ and leveraging the potential of the geoweb. In Cartography and Geographic Information Science 40 (2), pp. 130–139. DOI: 10.1080/15230406.2013.777137.

Gantz, J.; Reinsel, D. (2011): Extracting Value from Chaos, [International Data Corporation (IDC), Framingham, MA, 2011], www.emc.com/collateral/analyst-reports/idc-extracting-value-from-chaos-ar.pdf.

Haklay, Mordechai (2013): Neogeography and the delusion of democratisation. In Environ. Plann. A 45 (1), pp. 55–69. DOI: 10.1068/a45184.

Metaxas, P. T.; Mustafaraj, E.; Gayo-Avello, D. (2014): The Parable of Google Flu: Traps in Big Data Analysis. In Lazer, D., Kennedy, R., King, G., Vespignani, A. (Ed.): Big data. The parable of Google Flu: Traps in big data analysis. 343 volumes: AAAS, pp. 165–171.

Miller, Chrisopher C. (2006): A Beast in the Field: The Google Maps Mashup as GIS/2. In Cartographica: The International Journal for Geographic Information and Geovisualization 41 (3), pp. 187–199. Available online at 10.3138/J0L0-5301-2262-N779.

Shelton, T.; Poorthuis, A.; Graham, M.; Zook, M. (2014): Mapping the data shadows of Hurricane Sandy: Uncovering the sociospatial dimensions of ‘big data’. In Geoforum 52, pp. 167–179. DOI: 10.1016/j.geoforum.2014.01.006.

Sui, D. Z.; Elwood, S. (Eds.) (2013): Crowdsourcing geographic knowledge. Volunteered Geographic Information (VGI) in theory and practice. Dordrecht, Heidelberg [u.a.]: Springer.

Sui, D.; Goodchild, M. (2011): The convergence of GIS and social media: challenges for GIScience. In International Journal of Geographical Information Science 25 (11), pp. 1737–1748. DOI: 10.1080/13658816.2011.604636.

By Katja Bode and Felicia Linke

Introduction

VGI is increasingly used to support disaster risk management. This data can help to “update the situational awareness and to improve the operational response” (Terpstra et al. 2012).

However, it is often difficult to access the vast amount of data in an appropriate way. Visualization plays a key role to make this data easily understandable (Terpstra et al. 2012).

This blog entry gives an example of an approach to gathering useful information from tweets and concludes with the challenges of spatiotemporal visualization.

Approach

In the case of a disaster taking place it is very important to filter the relevant information shared on social media (like Twitter), which can actually contribute to the improvement of DRM strategies and its effectiveness. Crisis includes a large number of events, both personal and shared, many of which are not relevant in the field of DRM and are therefore not considered in the filtering process (such as a personal crisis or an economic crisis). In this discussion on helpfulness of data, it is necessary to restrict oneself to events that have constrained temporal and geographical extent (even if they are lengthy or broad) that affect large numbers of people and bring everyday life to a standstill.

The common steps which are necessary for making use of information shared shortly before, during and after a disaster on Twitter will be presented on the basis of the Application System Twitcident. Twitcident is a recently developed framework and Web-based system that automatically filters, searches and analyses tweets regarding incidents. The system was used during a storm in Belgium that hit the festival of Pukkelpop 2011 (which will be used as a case example).

The system contains three components.

FIRST STEP:

Data Collection à Search Harvest and Filter: The „raw data“ (i.e. tweets about a certain disaster) need to be sorted by their spatiotemporal occurrence in order to evaluate their relevance (further visualisation possible i.e. display data in a map)

Example from the Pukkelpop Festival: Gather all the Tweets, which are tweeted in the area of the festival side and in Belgium and the adjacent countries.

Geo-annotated tweets plotted on Google maps (TERPSTRA et al. 2012, p.3).

Fig. 1: Geo-annotated tweets plotted on Google maps (TERPSTRA et al. 2012, p.3).

SECOND STEP:

Data content assessment and validation/ interpretative analyses à All the data gathered in the first step need to be filtered again by specific words which are mainly used by Twitter-users during disasters.

Example from the Pukkelpop Festival: First filter for tweets including “Pukkelpop” or “PP11”.Then identify damage-related tweets by filtering tweets on keywords; i.e. ‘damage’, ‘devastate’, ‘collapse’, ‘destroy’, ‘ravage’/ Identify casualty-related tweets by filtering tweets on keywords: ‘casualty’, ‘injury’, ‘dead’, ‘died’, ‘death’, ‘kill’, ‘decease’ and conjugations of these terms.

THIRD STEP:

Analyse results for improving or establishing early-warning systems and coordinating first-aid-groups during the disaster.

Challenges in visualizing spatiotemporal data

There are many different types of spatial and spatiotemporal data which are increasingly made public and easily accessible. However, there are some difficulties before this data can be used in a certain way i.e. to be analysed for use in DRM.

Firstly there is a lot of data. Often this is too much to be analysed without filtering it before. Many times real time analysis are made and therefore it is necessary to handle the new data in a way that it fits in with previous data. Also, there might occur problems when different types or different qualities of data that may come from different sources are combined.

Another challenge is to support analysis at multiple scales and to find the right scale(s) for the data being used.

Users of social media often have different backgrounds so it is important to explore ways to understand and adequately support diverse users i.e. specialists and non-specialist.

It is necessary to present data in a way that users are able to explore it more easily. Instead of current complex GIS programs there should be used tools which allow different spatiotemporal visualization, support for analysis, and collaboration among others.

All these challenges need to be faced in order to develop an appropriate way to deal with spatiotemporal data. Key objectives should be to include characteristics of time and space, be visual, scalable, collaborative, lightweight and to deal with different and large data sets (Andrienko et al. 2010).

Literature:

Andrienko, G., Andrienko, N., Demsar, U., Dransch, D., Dykes, J., Fabrikant, S. I., … Tominski, C. (2010). Space, time and visual analytics. International Journal of Geographical Information Science, 24(10), 1577–1600.

Terpstra, T., & Vries, A. de. (2012). Towards a realtime Twitter analysis during crises for operational crisis management. In Proceedings of ISCRAM 2012 (pp. 1–9).

by F.Ruehl

The aftermaths of the 2010 Haiti earthquake have shown that the public can be engaged in response to an acute crisis and moreover is able to organize and engage itself. The involvement of citizens in reaction to (crisis-) situations is not new and has been practiced in citizen sciences for some decades. However, the spontaneous emerging of volunteers around the world, contributing information and processing data to effectively respond to a disaster like the Haiti earthquake is a new phenomenon.

Both citizen science and digital volunteerism are offering capabilities to bridge information gaps, particularly in crisis situations where infrastructure and traditional information systems are broken or crisis response mechanisms are overloaded. Crowdsourcing offers the capacity to quickly process huge amounts of data and might represent the only source of information in certain situations. Consequently, crowdsourcing and especially volunteered geographic information (VGI) is necessary to complete official information for policy makers and emergency responders in certain crisis situations.

This conclusion, however, raises the question of how such information can be incorporated into disaster risk management. That’s the topic of this blogpost and further seminar work.

The question of incorporation of VGI faces a major problem: „What is lacking in the field of crisis informatics is a conceptual framework … to integrate and operationalize crisis crowdsourcing into the official emergency management environment.“ (Liu 2014: 6).

To solve this problem Liu (2014) develops a Crisis Crowdsourcing Framework. Activities like VGI and their integration in management processes are a cooperative work, therefore Liu builds up the framework based on Fujak et al.’s six dimensions of cooperative work (cf. Liu 2014: 17).

Those dimensions are (Liu 2014:; 18):

Why: “Identify the information problem to determine the crowd task needed”

Who: “Identify the types of crowds and expertise needed for the crowd task”

What: “Identify the interaction flows for engaging crowds“

When: “Identify temporal aspects in relation to the disaster lifecycle”

Where “Identify spatial aspects of the crisis, crowds, and crowd tasks”

How: “Identify social, technological, organizational, and policy (STOP) interfaces”

The last dimension we would like to focus on in this blogpost, since the question of how VGI can be integrated by identifying certain interfaces, is directly linked to all other five dimensions. The first five dimensions drive the way of incorporation into the disaster risk management processing. This fact gets obvious when looking on the necessary conditions for a successful incorporation. According to Liu (2014) it is necessesary to focus on “Social, Technological, Organizational, and Policy (STOP) interfaces to operationalize” VGI in the disaster risk management environment.

The social interface covers all questions of the crowdsourcing phenomenon as it comes to social standards such as norms and practices concerning the topic of VGI, for example. Often concerns are risen about data reliability, which stem from the fact that crowdsourcing tasks are not only proceeded by professionals. However, trust in data is strongly connected to the dimension of who is proceeding and what kind of data is in process. Is there mutual trust between for example international agencies and volunteers? A good empirical example for a close relationship and shared norms are the ties between the UNOCHA (United Nations Office for the Coordination of Humanitarian Affairs) and a volunteer community called Standby Task Force through the Digital Humanitarian Network (DHNetwork). For years both sides have been working together effectively. In general, decision makers need to be convinced by the capabilities of crowdsourcing and they need to trust in the information gathering process due to encouraging experiences in the past or shared norms and beliefs.

The development of technical systems or tools further influences the question of incorporation and is treated as technological interface. Without adequately designed technical backing delivering the demanded data would be impossible for a crowdsourcing. Systems have to be able to proceed and carry large amounts of data and have to offer a user-friendly surface to proceed tasks without failures due to wrong usage. For example, if a government agency demands for volunteers interfaces are needed addressing both the agencies demands and the users ability to work with it as a tool. Thereby the question of technical design is obviously linked to the question, which users (=who) should be addressed and what kind of crowd interaction is necessary to succeed the tasks.

Conflicting situations between agencies, emergency response bodies and the public are common in crisis situation. The organizational interface encompasses the recognition of such conflicts and the integration of new elements into standard procedures and workflows. Therefore the DHNetwork can be seen as an example of an organizational interface to incorporate crowdsourcing into the decision-making process of the UN agencies.

The policy interface plays a major role when it comes to legal standards and challenges. Often, law poses restriction to the usage of data. For example, expensive high-resolution satellite imagery is usually not available free of charge. However, such data is often needed to actively support the work of the volunteers when for example mapping crisis situations. Given the exceptionalism of most large-scale disaster situations, such data is usually provided free of charge. However, in smaller scale situations where crowdsourcing would bring major advantage such data can’t be use. When using data of social networks it has to be clear that such data usage is covered by the terms of usage and data protection standards.

All these interfaces have to be taken into consideration if one would answer the question of how to incorporate VGI into Disaster Risk Management. Additionally, if one would set guidelines for the whole process, even the way VGI is generated one has to take into account the other five dimension in detail before dealing with the question of how to incorporate the information into management procedures All this has to be addressed „to better support the mass-coordinating challenges“ (Liu 2014: 6) not only in this seminar but in the disaster management as a whole.

Literature and recommended readings:

Liu S. B. (2014): Crisis Crowdsourcing Framework: Designing Strategic Configurations of Crowdsourcing for the Emergency Management Domain. In: Computer Supported Cooperative Work (CSCW).

Vivacqua, A. S. & Borges, M. R. S. (2012): Taking advantage of collective knowledge in emergency response systems. In: Journal of Network And Computer Applications, 35(1), 189-198.

Roche S., Propeck-Zimmermann, E. & Mericskay, B. (2013): GeoWeb and crisis management: issues and perspectives of volunteered geographic information. In: Geo Journal, 78(1), 21-40.

Crowley J. (2013): Connecting Grassroots and Government for Disaster Response. Washington D.C.

Cobb, C., McCarthy, T., Perkins, A., Bharadwaj, A., Comis, J. Do, B. & Starbird, K. (2014): Designing for the Deluge: Understanding & Supporting the Distributed, Collaborative Work of Crisis Volunteers. In: Proceedings of the Computer Supported Cooperative Work 2014.

HIS (2011): Disaster relief 2.0: The Future of Information Sharing in Humanitarian Emergencies. Washington D.C. and Berkshire, UK.

OCHA (2013): Humanitarianism in the Network Age (including World Humanitarian Data and Trends 2012). Retrieved from on 10/31/2014 from: http://www.unocha.org/node/11528

Tapia, A.H. & Moore, K. (2014): Good Enough is Good Enough: Overcoming Disaster Response Organizations’ Slow Social Media Data Adoption. In: Computer Supported Cooperative Work (CSCW).

By Felix Bühler and Jan Sichau

Introduction

Nowadays social media plays an important role in disaster risk management. Information from platforms like Twitter can be searched, extracted, and used for gathering a huge amount of information in a very short time and furthermore these information are linked to a specific position, from where the information was published.

Therefore incidents like natural hazards can be threatened in a very fast way, as well as other incidents like counter terrorism, pandemics and other emergencies. With such an amount of information Twitter offers, there has to be a way how this mass of data is going to be managed. In this specific case, the system of the CCC, the Australian Government Crisis Coordination Centre, is described as an example of how a system is built up.

Crisis Coordination

The aim of the crisis coordination is to “deliver the right information to the right people in the right format in the right place at the right time” (Cameron, M., Et Al. 2012). In order to reach this goal, the Endsley model of situation awareness plays an important role. For this huge data coming up, there is no possible way to manage it manually. A computer is needed in order to process the steps.

The first step is the situation awareness. It is split up in three levels: First of all, Perception. This means accumulate data based on information such as position, keywords, reposts, etc. In the second level (Comprehension) the classified data needs to be understood. For example the difference between a current earthquake and tweets from a famous football match. The last level (Projection) is going to determine whether there will be more upcoming data of this specific case or not. In the second step it is important to decide whether this accumulated information is important for the CCC or not. Known keywords or regions where natural hazards are going to happen can influence this decision making. The third and last step is the action on how this incident is going to be managed and how this action will be performed.

By processing this model by computers, five problems occur, which need to be solved, since a computer can’t think and therefore can’t decide by themselves which incidents are important ones.

Problems

1. Automatically find unexpected incidents or information, such as uncommon tweets

2. Cluster these information without getting the awareness of the specific incident

3. Understand and value these clusters and as a result getting the awareness of the specific incident

4. Observe the incident. This means, getting information about the location, the duration and issues coming up with the incidents

5. Analyse the incident chronological. What happened before, during and after the incident?

How these problems can be solved

The CCC has its own system to determine these problems, called ESA-AWTM, the “Emergency Situation Awareness – Automated Web Text Mining”. This architecture has several engines to solve the problems stated above. For the first problem, it executes a burst detection method, which means collecting same keywords, same location or other similar attributes and even visualizes them in an alert monitor. With this visualization the second problem can be solved through a clustering taking place. The watch officer, meaning someone who supervises the visualizations, now sees the different burst messages in a condensed way and not only the single messages. He can therefore draw a conclusion about the potential incident. While clustering a set of information, there still might be more or less useless information shown in the visualization, which is weighted in the solution for the third problem. Information about the strength or the more accurate position about an incident is more important than for example a personal opinion about the event. The ESA-AWTM solves to problem four by managing the incident. This means merge or split information-cluster, tracking them or even delete useless information. For example the Fukushima nuclear disaster resulting from the Tōhoku earthquake. For the last problem a Historical Alert Viewer is implemented. This means, that every incident is stored in a database which can be accessed, even offline. It can take therefore an important role by comparing current incidents with past ones and draw a conclusion about the strength and dimension in the past.

With this system some problems occur. For example legal aspects as Twitter’s Developers Rules of the Road which lead to an architecture based completely on the intranet (company-own network).

The system of Situation Awareness from Twitter does not replace older methods for crisis management, but is a huge improvement in the early awareness of an incident.

Discussion questions:

- Can this data be manipulated and is this a serious risk?

- How can the system be improved in extracting different information?

- How can this system be implemented in areas with limited access to social media

Sources

Cameron, M. A., Power, R., Robinson, B., & Yin, J. (2012). Emergency situation awareness from twitter for crisis management. In Proceedings of the 21st international conference companion on World Wide Web – WWW ’12 Companion (p. 695). New York, New York, USA: ACM Press.

Yin, J., Lampert, A., Cameron, M., Robinson, B., & Power, R. (2012). Using social media to enhance emergency situation awareness. IEEE Intelligent Systems, 27(6), 52-59

By Julia Balzer

After the earthquake of Haiti in 2010, a Crisis Map of Haiti was launched within just a few hours. By adapting the application of Ushahidi, a website with a crowdsourced map which was set up after the Kenyan election in 2008, the Crisis Mappers could transfer information of satellite imagery and social media into an online live Crisis Map which was used by several humanitarian organizations for saving hundreds of lives. This is just one example of how volunteers had participated in creating a map in order to support and actually disaster risk management.

But what people are the providers of those maps? Who are “Crisis Mappers”? How can they manage to make a map within that little time? The answer is pretty simple: Because mapmaking has democratized (Meier 2012, S. 90) in the last few years, everyone with little knowledge can take part in editing on maps. Beyond, Crisis Mapping actually depends on volunteer work (Ziemke 2012, S. 9) of plenty of “ordinary” people. In case of the Haitian Earthquake, thousands of ordinary people all around the world helped via social media to “aggregate, translate and plot” (HHI 2011, S. 8) the crowd sourced information onto the map the OpenStreetMap (OSM) community provided. The work of these volunteers is based upon the work of GIS experts who provide the technology and analytics for creating a Crisis Map which is free available and open to all Volunteers.

These volunteers, both citizen and experts, constitute different communities and as the Digital Volunteers help from all around the world, the community has to be virtual and is mainly organized via social media and other live communication technologies, for which reason they are called Volunteer Technology Communities (VTC). Examples of those communities are the International Network of Crisis Mappers, The Humanitarian OpenStreetMap Team (HOT) and The Global Earth Observation-Catastrophe assessment Network (GEO-CAN), to mention just a few. In those communities, different kind of people come together, University staff from different disciplines, diverse activists, bloggers, students etc. which are all part of the Crowd which is characterized by flat and decentralized structures (GFDRR, S. 3). This is essential for understanding the phenomenon of Crisis Mapping because without an underlying human network” (Meier 2012, S. 90) the crucial data wouldn’t be generated.

So what are the VTCs doing? There are several steps at making a map in which different parts of the community take part, from the beginning where data is collected, via analysis to the result:

  • Data acquisition (by disaster-affected people, citizen volunteers and experts)
  • Providing a platform (by experts)
  • Geo-locate the data (by citizen volunteers and experts)
  • Read/sort/translate/interpret the data (by citizen volunteers and experts)
  • Aggregate the data (by citizen volunteers and experts)
  • Visualization (by experts)

Above that, VTCs do much more in improving the quality and speed of the response, e.g. by training volunteers and disaster-affected people to do more advanced work or improving technical supports outside of crisis times.

What is conspicuous by reading texts about Crisis Mappers is the term network. Networking provides both communication and collaboration, essential parts of this new possibility of humanitarian aid. This is also the point we can tie in with because besides improving technology, the improve in networking, especially with other humanitarian organizations will be the crucial point in future to raise effectiveness of Disaster Mapping. But also the networking among the community itself need to be improved in order to share knowledge and learn collectively. Because the power of Crisis Mapping lies in the amount of people who are using it: the crowd.

GFDRR. (n.d.) Volunteer Technology Communities: Open Development (p. 20). Washington, D.C., USA. Online: http://www.gfdrr.org/sites/gfdrr.org/files/documents/Volunteer%20Technology%20Communi ties%20-%20Open%20Development.pdf

Harvard Humanitarian Initiative. (2011). Disaster Relief 2.0: The Future of Information Sharing in Humanitarian Emergencies (p. 72). Washington, D.C. , USA and Berkshire, UK. Online: http://www.unfoundation.org/assets/pdf/disaster-relief-20-report.pdf

Meier, P. (2012). Crisis Mapping in Action: How Open Source Software and Global Volunteer Networks Are Changing the World, One Map at a Time. Journal of Map & Geography Libraries, 8(2), 89-100.

Ziemke, J. (2012). Crisis Mapping: The Construction of a New Interdisciplinary Field? Journal of Map & Geography Libraries, 8(2), 101-117.

By Sophie Crommelinck

In case of a natural disaster authoritative data often does not provide enough information necessary for coping with the situation: For humanitarian aid, affected areas need to be rapidly identified, so help can be offered where it is most needed. Therefore aid authorities prioritize areas in a so-called damage assessment ranging from “unaffected” to “destroyed”. Satellite remote sensing is one major tool used for assigning these categories. However, in case of hurricanes for example, high-resolution remote sensing data from satellites might be unavailable for days because of cloud cover or orbital limitations of revisit time (Schnebele et al., S. 1007). In cases of flood, limited spatial resolution of satellite data may hinder the detection of small flooded areas in vegetated, commercial or residential areas (Triglav-Cekad, S. 2753). To gain additional insight of ground conditions during and after the disaster, volunteered geographical information (VGI) is increasingly used.

VGI as an “emerging and quickly growing data source” (Goodchill in Schnebele et al., S. 1008) can be further divided into two groups of relevant data for disaster risk management includable in authoritative data:

1) Data that is collected and offered by volunteers for a specific purpose (participatory sensing, collaborative mapping and analysis). An example for this is a mission launched by the Civil Air Patrol, the civilian branch of the US Air Force, after Hurricane Sandy in 2012: Volunteers flew along the coastline of New Jersey capturing thousands of aerial photos documenting heavily flooded areas. These were then published through the Federal Emergency Management Agency for residents to check by street address if their house had been damaged (Schnebele et al., 2014).

2) Secondly VGI as a large amount of anonymous data is analysed for a specific purpose (collective sensing). The data can for instance consist of images, videos, sounds and text messages extracted from social media. In contrast to the first group of data, the volunteers did not initially share the content for this purpose and should therefore be considered contributors rather than volunteers. This geographical information is nevertheless defined under the label VGI. An example for this is an analysis of twitter data during the Elbe flood, prioritizing the data according to its geographical relation to the flood phenomenon. Thereby its credibility can be assessed; a step required before integrating the data in authoritative data (Herfort et al., 2014).

Despite these positive examples, VGI is mostly regarded as insufficiently structured, documented and validated according to scientific standards (Schade et al., S. 3). It therefore needs to be integrated into the existing Spatial Data Infrastructure (SDI), an institutionally sanctioned framework for posting, discovering, evaluating and exchanging geospatial information. These efforts are summoned under the term VGI Sensing (De Longueville in Schade et al., S. 4).

With VGI relying on humans reporting changes in their environment together with traditional authoritative data, gaps in the spatial and temporal coverage of information could be reduced. Reducing the volume of VGI to credible and relevant content is of major importance for a successful usage of VGI. But how can the volume of VGI be reduced to representative data? Which aspects of disaster risk management can be addressed by incorporating VGI in authoritative data? How much is VGI data already seen as a mandatory part of authoritative data? Do you know of any examples?

Questions to be answered during the seminar Disaster Mapping 2.0…

Sources:

Herfort, B., Albuquerque, J. P. De, Schelhorn, S., & Zipf, A. (2014). Exploring the geographical relations between social media and flood phenomena to improve situation awareness A study about the River Elbe Flood in June 2013. In Proceedings of the 17th AGILE Conference on Geographic Information Science (pp. 1–19).

Kamel Boulos, M. N., Resch, B., Crowley, D. N., Breslin, J. G., Sohn, G., Burtner, R., … Chuang, K.- Y. S. (2011). Crowdsourcing, citizen sensing and sensor web technologies for public and environmental health surveillance and crisis management: trends, OGC standards and application examples. International Journal of Health Geographics, 10(1), 67. doi:10.1186/1476-072X-10- 67

Lue, E., Wilson, J. P., & Curtis, A. (2014). Conducting disaster damage assessments with Spatial Video, experts, and citizens. Applied Geography, 52, 46–54. doi:10.1016/j.apgeog.2014.04.014

Schade, S., Díaz, L., Ostermann, F., Spinsanti, L., Luraschi, G., Cox, S., … Longueville, B. (2011). Citizen-based sensing of crisis events: sensor web enablement for volunteered geographic information. Applied Geomatics, 5(1), 3–18. doi:10.1007/s12518-011-0056-y

Schnebele, E., Cervone, G., & Waters, N. (2014). Road assessment after flood events using non- authoritative data. Natural Hazards and Earth System Science, 14(4), 1007–1015. doi:10.5194/nhess-14-1007-2014

Spinsanti, L., & Ostermann, F. (2013). Automated geographic context analysis for volunteered information. Applied Geography, 43(null), 36–44. doi:10.1016/j.apgeog.2013.05.005

Triglav-Čekada, M., & Radovan, D. (2013). Using volunteered geographical information to map the November 2012 floods in Slovenia. Natural Hazards and Earth System Science, 13(11), 2753– 2762. doi:10.5194/nhess-13-2753-2013

www.esri.com/library/brochures/pdfs/spatial-data-infrastructure.pdf, 20th October, 2014.

Projects to get involved:

- healthmap.org

- lovecleanstreets.com

- geonames.org

- grassrootsmapping.org

- mapmill.org

- medwatcher.org

- pulsepoint.org

Older Posts »