Feed on
Posts
Comments

By David Max and Nicolás Gómez Armisén

Abstract
This text describes the idea, methods and use of social media during and after the event of a disaster. After defining what social media is and pointing out its advantages in disaster management we focus on its use during and right after a disaster. Our aim is to inform about the new possibilities for geographers derived from the use of social media during and after a disaster in order to create maps and process information via Web 2.0.

Introduction
Nowadays communication technologies allow a flow of information characterized by enormous speed, high magnitudes and a wide reach. People do not only receive information faster than ever but can use a broad range of media and sources to generate information in real-time (VIEWEG et al 2010). In other words, those technologies provide users with the ability to respond quickly to environmental changes and provide more flexibility, adaptability, usability and customizability with respect to both the system and the information (DAVES, Y & SCOTT, P, 2010, p. 3). Social media “supports the creation of informal users’ networks facilitating the flow of ideas and knowledge by allowing the efficient generation, dissemination, sharing and editing/refining of informational content” (CONSTANINIDES & FOUNTAIN, 2008, p. 231).
An example for the pre-named media are microblogging sites such as Twitter. Microblogging tools are present in a variety of platforms and facilitate immediate communication among people. It is part of a growing communication phenomenon - namely social media - and present in almost all parts of the world (VIEWEG et al 2010).

Social Media
KANE et al (2014) define social media networks by outpointing that they allow their members to “(1) have a unique user profile that is constructed by the user, by members of their network, and by the platform; (2) access digital content through, and protect it from, various search mechanisms provided by the platform; (3) articulate a list of other users with whom they share a relational connection; and (4) view and traverse their connections and those made by others on the platform“.
In line with Kane’s et al. definition, Dave, Y and Scott (2010) described social media as a tool that enables open online exchange of information through conversation and interaction. Unlike traditional internet and communication technologies (ICTs), social media manages the content of the conversation or interaction as an information artifact in the online environment. They add that, social media is part of a number of emerging technologies with the potential to improve flexibility, adaptability, and boundary spanning functionality demanded by response organizations for their information systems.
In view of the above we want do define social media as the international connection among people in virtual communities and networks in which they create, share or exchange any kind of information. Social Media has invented a big diversity of types. While some are used to spread news others connect people via Web 2.0 around the world. Data and posts (or microblogs) are available for everyone with internet access (STARBIRD, K et al 2010) . Social media platforms like Twitter evolve to a enormous network by connecting users with others. These networks are really effective not only in providing data but also in sharing specific information which can help during and after a disaster.
Twitter as tool
Social networking sites provide personal information of their users like name, location and other if the profile is public. Data is available for everyone with internet access (STARBIRD, K et al 2010). Social media platforms like Twitter (or platforms which copied the Twitter concept) evolve to an enormous network by connecting users with each other. Twitter, in particular, has a flexible communicative structure. It has two profile types, public (profile visible to all) and private (visible only for approved followers). Thanks to this feature, Twitter is more useful than Facebook which has a more complex visibility permission. The users can easily find and share hashtags related to the crisis event. (BRUNS and BURGESS, 2011).
The role played by social media in the coverage of natural disasters as well as in the mobilisation of affected locals and volunteers is increasingly being recognised (e.g., LIU, 2009; LIU, et al., 2008; Mark and SEMAAN, 2008; MENDOZA, et al., 2010; SHKLOVSKI, et al., 2008; SUTTON, et al., 2008).
There exist various types of methods for analysing the Tweets. Bruns and Burgess (2011), for example, describe and explain one method for the tracking and analysing hashtag–based Twitter activities which built on the open source tool “yourTwapperkeeper” (2011) and uses a number of additional tools to process and visualise Twitter activities.
During
The best way to explain how social media can help during a disaster is to make use of an example. That is what most authors do in their papers as in the following papers (AHMED, ASHIR; SINNAPPAN, SUKU, 2013; YATES, DAVE; PAQUETTE, SCOTT, 2011; VIEWEG, SARAH, et al, 2010).
Thanks to the features of the tool that we have already mentioned, users are able to produce large amount of information that can be extracted with different tools to check the status of disaster episode in which it is studied. Thanks to detailed descriptions including geographical information, posts can be used in order to determine the exact location and the status of the disaster.
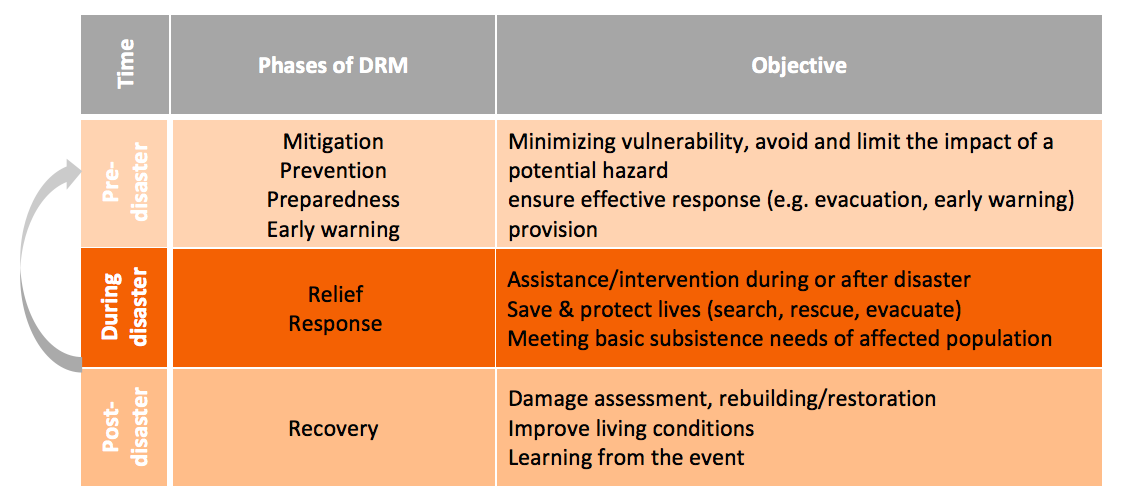
The border between during and after of a disaster is hard to draw. We understand the end of a disaster as the moment in which it is controlled and post-disaster actions begin. We also classify disasters according to the duration. While earthquakes are normally of a short duration in the sense that vibrations only last a limited period, inundations have a more permanent character. Therefore, data describing the after in case of an earthquake is more important for disaster management.
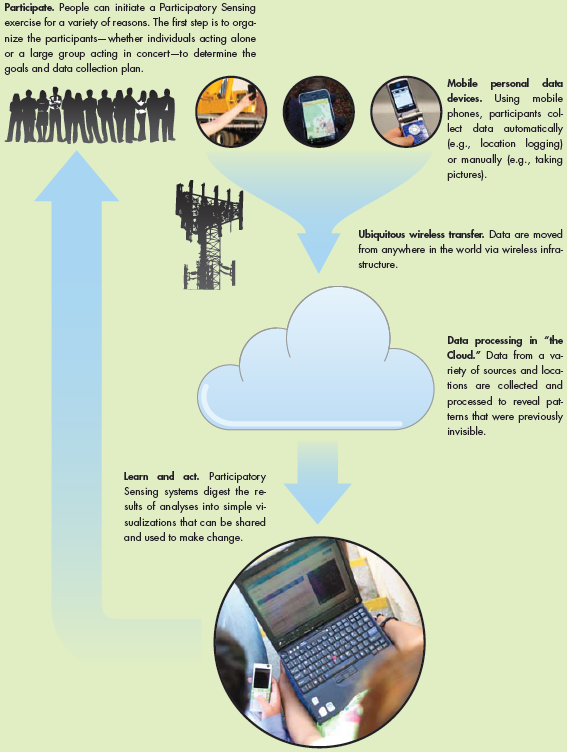
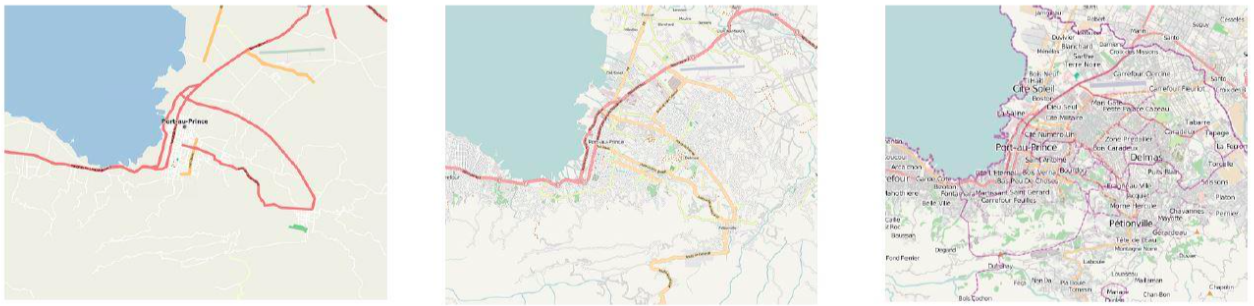
The information created by Twitter user help to understand what is happening in an event with many actors and other moving parts, especially with respect to the needs of command and control operations (VIEWEG et al 2010). To use the data extracted from social media, it is important to be thorough in the process of validation and corroboration (GAO H., et al. 2011). Again, the use of tools, often created for each of the cases (BRUNS, A; LIANG, Y.E., 2012), will help in the task of identifying post that provide useful information in order to take actions during a disaster. Users can include geo-referenced information, which can be useful for organizations or institutions in order to create maps that can be used to plan actions of mitigation in the affected regions. The information on which the maps are based is derived from a geo-tag or directly expressed addresses or geo-referenced images of smart phones. (GAO, H., et al, 2011 & VIEWEG, S. et al, 2011.
During the disaster data is collected from emails, forms, tweets and other media networks and arranged in terms of emergency, needs, people injured and so on (GAO, H., et al. 2011). With the objective of knowing in what form action is required we can determine the location with the use of maps and geo-referenced information obtained. The aforementioned possible ways of dealing with the data produced in social media networks are extracted from concrete examples of data usage during real-life disasters analysed in various research articles.

Use after the disaster
Social media is used as an alternative communication channel during and after a disaster. Yet after such an event people in the affected region use social media in a different way. While information is posted on Twitter during a disaster mainly by affected people, Facebook is the platform which spreads the news about the disaster around the world (AHMED et al 2013). These posts on Facebook show to the rest of the world what happened and make them focus. Research shows that social media is an increasingly used possibility in Disaster Risk Management (DRM) and an effective way to get people’s attention.
Supporting people after the disaster is one thing social media can help with. Its actual power is, as already said, the speed and the huge amount of people who are connected. Such a network cannot just add, edit and change information. They can work as an early warning system using the crowd sourced data of the last disaster (GAO H., et al. 2011). As mentioned spreading news via Web2.0 is the fastest way to ensure that people worldwide or in a specific region receive important information. If there is a disaster coming up the social media networks can spread and share important information so people can prepare themselves on what is going to happen, where to find shelter and where to find help.
Conclusion
Social media is one of the most important ways people are able to communicate around the world in today’s time. Based on a web 2.0 network it is able to share information faster and more effective than other media networks. In the last years its meaning got more and more important. Especially the use during and after disaster is an important point. Affected people can use social media networks like Twitter or Facebook to add, share and edit information which can be used as support for other affected people or first helpers. Because it is a fact that there will be disasters in the future the significance of social media networks and its possibilities will grow. The questions now is: How can we improve the networks so they can work in a more effective way during and after a disaster.

KAPLAN, Andreas M.; HAENLEIN, Michael. Users of the world, unite! The chal lenges and opportunities of Social Media. Business horizons, 2010, 53.1: 59- 68.

AHMED, Ashir; SINNAPPAN, Suku. The role of Social media during Queensland floods: An Empirical Investigation on the Existence of Multiple Communities of Practice (MCoPs). Pacific Asia Journal of the Association for Informationsytems, 2013, 5.2: 2.

YATES, Dave; PAQUETTE, Scott. Emergency knowledge management and social media technologies: A case study of the 2010 Haitian earthquake.International Journal of Information Management, 2011, 31.1: 6-13.

VIEWEG, Sarah, et al. Microblogging during two natural hazards events: what twitter may contribute to situational awareness. In: Proceedings of the SIGCHI Conference on Human Factors in Computing Systems. ACM, 2010. p.1079-1088.

GAO, Huiji, et al. Harnessing the crowdsourcing power of social media for disaster relief. ARIZONA STATE UNIV TEMPE, 2011.

LINDSAY, Bruce R. Social media and disasters: Current uses, future options, and policy considerations. Congressional Research Service, 2011.

MERCHANT, Raina M.; ELMER, Stacy; LURIE, Nicole. Integrating social media into emergency-preparedness efforts. New England Journal of Medicine, 2011, 365.4: 289-291.

By Johanna van Megern

The vast development of modern technology holds many positive developments in the field of VGI and DRM. Web 2.0 is an evolution of interactivity between users and web pages that is changing our lives in a way no one imagined only a decade ago. One of the areas influenced by Web 2.0 is Cartography and Mapping in general. Volunteers from thousand miles away can help create a map of roads and houses in hazardous environments. Volunteered Geographic Information (VGI) finds its origins outside the data collection of scientists or geographers. Therefore it is important to establish a type of quality assurance for people who want to use the information, as it needs to be identified if it is fit-for-purpose. The question that sums up the issue is, whether or not it is possible to trust the information provided by VGI? (Goodchild & Li, 2012)

Up until recently, the organization, creation and distribution of geographic information were done by official agencies and the production was an industrial scientific process. The outcome was a highly standardized, expensive product, which was engineered carefully, and fit to be used for a variety of purposes. So stepping away from this process leaves many scientists worried about the quality assurance. Without a doubt, VGI has many advantages. It provides geographic information free of charge, is often more up-to-date than high priced programs, it maybe even more detailed in especially dense neighborhoods and it often contains very specific markings from a specific group of peers (For example: Good look out points for photographers etc.) . However, taking a closer look at VGI shows that it also holds many disadvantages. It is possible to manipulate certain information; anyone, trained or not, can upload or edit information without giving proof of reliable sources. Can we trust or even use geographic information coming from:

· Anonymous sources (with no authority and with no responsibility)

· Contributors with unknown intellectual background (non-professionals in cartography or geography)

· People who do not provide metadata

· People who create spatial information with unknown incentives, and data completeness or even accuracy

· People who do not uphold quality standards

(Flanagin & Metzger, 2008)

The quality of spatial geographic information depends on the credibility of the sources. In order to define and understand credibility, Flanagin and Metzger differentiate two dimensions: the trustworthiness and expertise. A credible source should contain both trust and expertise in combination. Furthermore, they distinguish between two types of credibility - the credibility-as-accuracy and the credibility-as-perception. The first one underlines the accuracy of information and its adequacy to describe and evaluate “scientific knowledge production” (Flanagin & Metzger, 2008). The credibility-as-perception makes use of the notion of believability; many VGI today are based on information, opinion or perspective people believe, rather than scientific data accuracy. This type of credibility is mostly used for social or political purpose and establishes the social and political power of VGI. Therefore, VGI systems need to be understood as socio-technical systems in which the social aspect is as important as the technical component.

Furthermore, a study by L. See focuses on the difference in quality of data between non-expert and experts, finding that the differences are close to not existing. It was even stated that due to population density, some rural areas have more accurate and up-to-date information in OSM than in professional geographic data sets. The Linus’s Law (the more eyes to review, the more accurate the information) can, however, not be applied to areas with scarce population because the quality of information cannot be guaranteed. This emphasizes that VGI is inherently heterogeneous; some areas receive more attention than others. Despite the Linus’s Law or crowd-sourcing approach, Goodchild and Li also propose a social solution which relies on a hierarchy of moderators and gate-keepers; all volunteered information are referred up the hierarchy to ensure their accuracy, consistence as well as geographic standards. Thirdly, he proposes a geographic approach, which uses geographic knowledge to verify that the given information is part of the natural world. This process includes looking at recorded information that might be outdated, and compare it to the VGI to see how much of the information already known appears in the edited information. Those three approaches are likely to be used in combination in order to ensure a higher success rate. (Example: OSM)

Overall, the field of VGI is rapidly evolving and forces the expert producers to rethink their old fashioned approaches of spatial productions. However, the sustainability of user-generated VGI rests on an improved management of contributors and contributions to ensure that the spatial date stays on a high quality standard.

Discussion questions:

  1. What is the motivation of active contributors? (What is your motivation?)
  2. Do you have ideas on how VGI and professional geographic agencies can work together in the future?
  3. What are the most important qualities of geographic information and how can those be assured in VGI?

Sources:

Flanagin, A. J., & Metzger, M. J. (2008). The credibility of volunteered geographic information. GeoJournal, 72(3-4), 137-148. doi:10.1007/s10708-008-9188-y

Goodchild, M. F. & Li, L. (2012). Assuring the quality of volunteered geographic information. Spatial Statistics, 1(null), 110-120. doi:10.1016/j.spasta.2012.03.002

See, L., Comber, A., Salk, C., Fritz, S., van der Velde, M., Perger, C.,… Obersteiner, M. (2013). Comparing the quality of crowdsourced data contribution by expert and non-experts. PloS One, 8(7), e69958. doi:10.1371/journal.pone.0069958

By J. Kramp

Resilience in the case of a disaster is described by the MCEE as: “reduced probability of system failure, reduced consequences due to failure, and reduced time to system restoration.” (vgl. MCEE, 2014) All this is the goal to be achieved through experimental socio-technological changes like Volunteered Geographic Information (VGI).

A case study in Nepal in the Kathmandu Valley will provide some real life experience to illuminate the role VGI’s played in the conducted action research project Open Cities Kathmandu. Most of the area in the Valley is highly at risk. The idea was to experiment with new socio-technical platforms like Open Street Map (OSM). These platforms have the huge advantage of being openly accessible but the experimental/challenging part is the contribution and involvement of digital Volunteers. To reach the affected people and involve them, the team contacted mostly universities and technical communities on site to have them operate on a grassroots level. This is already a big step in order to build sustainable resilience. Especially Universities had the potential to stick with the project and sustain in updating the data for the information system. To win more participants the project organized several introductory presentations and mapping parties. The Web2.0 with all its facets like Twitter, Facebook and other social media was used for major participation and communication (vgl. Soden, et al.).

By implementing this new technological strategy, it is possible that the staff in a medical center gets the information where damage, road-blockings and so on, are. Beyond that they also tried to tackle the stage of preparedness. They raised awareness by making information publicly available which could be used for planning and coordination purposes. This improved preparedness can be seen as a factor to reduce risk by being able to respond quicker in the aftermath of disasters (vgl. Soden, et al.).

Another step to resilience is creating a disaster risk model to determine the vulnerability of buildings in the area of affection. It can be used for examining which schools and health facilities need retrofits for structural integrity in case of an earthquake. By securing the building structures the risk of destruction might be reduced (vgl. Soden et al.).

The use of VGI’s enables you to reach your goal of building resilience and preparedness (reduced probability of system failure, reduced consequences due to failure, and reduced time to system restoration.”). The digital map created, assists in case of a hazard and therefore helps minimizing a system failure and in the worst case scenario it can help reducing the consequences. A detailed map is also essential for the system restoration. Covering all these aspects VGI’s seem to have a very bright future in the disaster risk management even though the conductors of the Nepal project discovered some challenges. The final use of the collected data is not ideal because politics have not realized the importance of the information and tend to not use it (vgl. Soden, et al.). Interesting research questions for example would be:

How can VGI’s gain more influence in decision-making (e.g. retrofits)?

How to make needed technology available in the area of risk?

Readings:

Soden, R./ Budhathoki, N./ Palen, L. (2014): Resilience-Building and the Crisis Informatics Agenda: Lessons Learned from Open Cities Kathmandu. Proceedings of the 11th International ISCRAM Conference. Online unter: https://elearning2.uni-heidelberg.de/pluginfile.php/261877/mod_resource/content/1/SodenBudhathokiPalen-ISCRAMKathmandu.pdf (zuletzt abgerufen am 26.10.2014).

Alexander von Humboldt Foundation (2012): AGORA - An open Geospatial Participatory Architecture for Building Resilience against Disasters and Climate Change Impacts. Combining Participatory Environmental Monitoring and Vulnerability Communication. Online unter: http://people.ufpr.br/~tobias.dhs/aeba/seminario/13-JoaoP.pdf (zuletzt abgerufen am 26.10.2014).

Horita, F. E. A./ Albuquerque, J. P. de (2013): An Approach to Support Decision-Making in Disaster Management based on Volunteer Geographic Information (VGI) and Spatial Decision Support Systems (SDSS). Proceedings of the 10th International ISCRAM Conference. Online unter: http://www.iscramlive.org/ISCRAM2013/files/221.pdf (zuletzt abgerufen am 26.10.2014).

MCEER (2014): MCEER’s Resilience Framework. Resilient Concept Drives Development of New Knowledge, Tools &Technology. Online unter: http://mceer.buffalo.edu/research /resilience/resilience_10-24-06.pdf (zuletzt abgerufen am 26.10.2014).

By Dirk Wetzlar

Due to the increasing use of sophisticated mobile personal communication devices (MPCDC), particularly smartphones, the possibilities for citizens to collect, share and combine data have increased in the last years. With features like cameras, microphones, GPS and access to internet built into MPCDC, people using them can easily gather data, combine them with their geographical location and share them with other people through the internet (Ferster & Coops, 2011, p.340). This does not only offer citizens the opportunity to contribute to research projects (citizen science) it also can lead to changes in many aspects of our everyday-life (Goldman, 2009, p.4).

However, we are just at the beginning of this process and it is difficult to see how strong will be the impact in the future.

The term “citizen science” describes the participation of voluntary citizens, which do not necessarily need academic qualifications, in projects of science. Under the notion “citizen science” you can understand different activities. The categorization of these different activities can be done through the level of participation of the volunteers in the different projects, which is a really important point. The exact participation of the citizens can vary a lot of. For example Haklay (2013) introduces a participation-levels approach (Fig. 1). So, it is possible, among other things that citizens carry out the whole research project, which fits under the definition of “extreme citizen science” (level 4). On the other hand, participation in the meaning of “Crowdsourcing” (level 1) requires just a passive contribution from its participants, like to provide computing power (Haklay, 2013, p.11). Although, according to Ferster & Coops (2011, p.342), it is more common that citizens collect, process and provide data and a lead researcher exercise the main function (so called consultative/ functional structure).

Participation-levels approach (Haklay, 2013, p.11)

Fig. 1 Participation-levels approach (Haklay, 2013, p.11)

Participatory sensing is one part of citizen science, which describes in general the active use of sensors from devices like smartphones by citizen to collect and interpret data from the environment (Goldman, 2009, p.3). A chart of the process of participatory sensing is shown in figure 2. The degree of the involvement of the citizens varies within different projects. By it Goldman (2009) distinguishes three different models of participatory sensing on the basis of the participation. These are: Collective Design and Investigation, Public Contribution and Personal Use and Reflection. In the first model a group of individuals collaborate in a project and they are responsible for the entire process, whereas “Public Contribution” normally just means that citizen gather data, “but [are] not necessarily [involved] in the definition of research questions or use of the results” (Goldman, 2009, p.4). The last type, “Personal Use and Reflection”, means that the data collected by an individual is used just for his personal interest, which can help, among other things, to reflect our actions and daily routines.

Chart of the process of participatory sensing (Goldman, 2009, p.5)

Fig. 2 Chart of the process of participatory sensing (Goldman, 2009, p.5)

Like with everything, there are as well involved in these developments certain possibilities but also risks. Really positive is the increase public knowledge and interest for science, which results from the participation of citizen. Also it is possible to collect data for a bigger spatial expansion and with a higher temporal frequency, which play an important role in disaster risk management (Ferster & Coops, 2011, p.341). However, a critical point is the privacy and the security of the collected data. On this matter Goldman (2009, p.6) argue, that in the use of sensing systems should be as much privacy as in other parts of our live. Another point is the accuracy of the data, provided by citizens. Although there are empirical analyses, which are showing that volunteers can work as accurate as professionals, there might arise some errors, due to technology, training or intention of the citizens. Therefore, the more people participate in projects, the more accurate data can be expected (Connors, et. al, 2011, p.1282).

Citizen science and participatory sensing can contribute to disaster risk management in a lot of different ways, above all by their strengths which are mentioned above. They can be useful not only during the disaster, but also before and after it.

In general through the participation of citizens in science they might get aware of existing problems, after which ideally the individuals act to reduce their vulnerability. Also people take part in participatory science projects can help with their local knowledge.

The strength to gather data for a big spatial expansion is especially useful, if there are widespread phenomena, like Wald (2011) shows in his paper for earthquakes. Through this project, it was possible to collect information about the distribution of shaking intensity for the entire USA, which “we have never been able to show before” (Wald et al., 2011, p.694). With this information scientists may get a better understanding of the subject.

The strength to provide, through the participation of numerous people, a big amount of data, which is up-to date, is for example essential in case of destruction. Keeping in mind that the gained data are from the ground surface, participatory sensing can perfectly replenish gathering data from remote sensing.

Goldman, J. et al. (2009). Participatory sensing: A citizen-powered approach to illuminating the patterns that shape our world, (May), 20. Retrieved from http://escolarship.org/uc/item/19h777qd.pdf

Connors, J.P., Lei, S. & Kelly, M. (2012). Citizen Science in the Age of Neogeography: Utilizing Volunteered Geographic Information Monitoring. Annals of the Association of American Geographers, 102(6), 1267-1289. Doi: 10.1080/00045608.2011.627058

Ferster, C.J. & Coops, N.C. (2013). A review of earth observation using mobile personal communication devices. Computers & Geosciences, 51, 339-349. Retrieved from http://www.sciencedirect.com/science/article/pii/S0098300412003184

Haklay, M. (2013). Citizen Science and Volunteered Geographic Information – overview and typology of participation in Sui, D.Z., Elwood, S. and M.F. Goodchild (eds.), 2013. Crowdsourcing Geographic Knowledge: Volunteered Geographic Information (VGI) in Theory and Practice. Berlin: Springer. Pp 105-122 DOI: 10.1007/978-94-007-4587-2_7

Wald, D.J. et al. (2012). USGS „Did You Feel It?” Internet-based macroseismic intensity maps. Annals of Geophysics, 54(6). doi:10.4401/ag-5354

By Bianca Kappl

Natural and anthropogenic disasters have occurred in history and will occur in future, because of global climate change, population growth or the spread of infectious diseases (ZOOK ET AL. 2010, 10). The Haiti Earthquake occurred in January 2010 could be regarded as a good example for a natural disaster in the context of Volunteered Geographic Information” (VGI). After this disaster, fast and extensive help was needed. The two major questions that immediately had to be answered then were who actually was in need of help and where these people were located. Comprehensive databases of assets, infrastructure, population and location were limited, which is why it was difficult for the responders to help in the disaster region (ZOOK ET AL. 2010, 14). The catastrophe in Haiti shows the necessity of geo-spatial information of a certain region in order to help people in need. Since geo-spatial information from that region was missing and this lack was corrected from volunteering mappers who organized themselves via internet. The information distributed through social media and Web 2.0 technology. Web 2.0 describes websites that allow users to collaborate with other users to work on projects like disaster response (NEIS ET AL. 2010, 6).

A popular example of Web 2.0-style mapping is the OpenStreetMap (OSM) project. Volunteers can create a free street map for the entire world by using Global Positioning System (GPS) trails and digitized street patterns from aerial imagery. In case of the earthquake in January 2010 the OSM project was an important source of Web 2.0 mapping, because people from developed countries enjoy better access to geodata than people from poor countries and with that knowledge they collected a lot of information for the responders (ZOOK ET AL. 2010, 11). This example illustrate that information technologies (IT) are an important part of disaster response. With the development of OSM and a variety of other web- based mapping services such as Google, the opportunity for volunteers to help in disaster response situations via mapping and other spatial analysis has grown significantly (ZOOK ET AL. 2010, 12). IT ́s were a key, because individuals can support relief work and aid agencies without actually being physically present in Haiti or other disaster areas. It can empower people from every place to work for the public good (ZOOK ET AL. 2010, 10).

The crowdsourced geo-spatial data and the collaborative maps have many benefits. Most importantly, this form of mapping allows to produce many maps in a short period of time (ZOOK ET AL. 2010, 12). The ability to leverage IT ́s to allow individuals to report on local and specific conditions is another important benefit of Web 2.0 and disaster mapping, too. When many people work together on a project without knowing each other, it is quite likely that because errors occur. However, a good thing about collaborative maps and crowdsourced geo-spatial data is, that “with enough people working together, any errors by one individual can be easily corrected by another” (ZOOK ET AL. 2010, 13).

Maps from OSM data showing Port-Au-Prince before the earthquake, two days after the earthquake and how it looks now (NEIS ET AL. 2010, 5)

Figure 1: Maps from OSM data showing Port-Au-Prince before the earthquake, two days after the earthquake and how it looks now (NEIS ET AL. 2010, 5)

Figure 1 shows three maps from the capital of Haiti Port-Au-Prince. The map on the left-hand side shows the situation before, the second one the situation two days after the earthquake. These are good examples of Volunteered Geographic Information(VGI), within a few days volunteers have organized user-generated datasets via Web 2.0. With maps like these and other spatial information the disaster management can be improved.

Nevertheless, collaborative maps do also have disadvantages. Since they are mostly created by nonprofessional people, the quality of the geo-spatial data is worse than the data from professional mappers, but it is more important to get immediate help, first of all during crises. Another attraction of volunteer mappers are to fill the blank spaces on the map, not alone during crises (ZOOK ET AL. 2010, 11f).

References:

ZOOK, M., GRAHAM, M., SHELTON, T., GORMAN, S. (2010): Volunteered Geographic Information and Crowdsourcing Disaster Relief: A Case Study of the Haitian Earthquake. World Medical & Health Policy, 2(2). doi: 10.2202/1948-4682.1069

NEIS, P., SINGLER, P., ZIPF, A. (2010): Collaborative mapping and Emergency Routing for Disaster Logistics Case studies from the Haiti earthquake and the UN portal for Afrika. In Geospatial Crossroad s@ GI_Forum 2010. Proceedings of the Geoinformatics Forum Salzburg (pp. 239-248). Salzburg, Austria.

Further reading:

HEIPKE, C. (2010): Crowdsourcing geospatial data. ISPRS Journal of Photogrammetry and Remote Sensing, 65 (6), 550557. doi:10.1016/j.isprsjprs.2010.06.005

RAMM, J. T. F. (2010): OpenStreetMap. Lehmanns Media GmbH.

SCHELHORN, S. J., HERFORT, B., LEINER, R., ZIPF, A., & ALBUQUERQUE, J. P. de. (2014): Identifying Elements at Risk from OpenStreetMap: The Case of Flooding. In Proceedings of the 11th International ISCRAM Conference (pp. 1 5).

GOODCHILD, M. F. (2007): Citizens as sensors: the world of volunteered geography. In GeoJournal 69:211221. doi 10.1007/s10708-007-9111-y

By Charlotte Stirn

If we study the past and recent news it gets apparent that disasters are happening nearly every day in many different forms, affecting the lives of many thousands and millions of people every year (current example: Ebola epidemic in Sierra Leone, Liberia and Guinea) (De Ville de Goyet).

Mankind has always been exposed to natural hazard and thus disaster but what has changed is the way how we deal with disaster in modern society. Modern communication systems led to the development of a disaster risk management system.

But first of all: What defines a disaster and disaster risk? Disaster risk is a combination of any kind of hazard and a vulnerable society (Fig. 1). A disaster only occurs if a hazard striking a vulnerable society results in significant injury or damage (Cova 2005).

Definition of disaster and disaster risk (after COVA 2005).

Fig. 1: Definition of disaster and disaster risk (after COVA 2005).

Disaster risk management (DRM) aims to deal with disaster by considering all these factors. It encompasses different phases of action that take place before, during and after a disaster (Fig.2).

The disaster risk management before the strike of a hazard involves mitigation, prevention, preparedness and the development of early warning systems. Geographic information systems (GIS) may be used for risk assessment (e.g. to predict the extent of a flood to coordinate evacuation) and long-term mitigation (e.g. avoid settling in highly vulnerable areas).

During and immediately after the occurrence of a hazard (phase of relief and response) the main effort comprises saving and protecting lives. Geospatial information like the position of collapsed buildings can be supportive for the search and rescue-teams or to find undestroyed pathways to hospitals or for evacuation. Shortly after the disaster the support of basic needs like water, food, shelter and medical support have to be restored.

Recovery is the final phase of DRM after the disaster which aims to improve the living conditions by rebuilding and restoration. Damage is assessed and gained information collected to learn from the event to be better prepared for future hazards (Cova 2005, De Ville de Goyet 2008, NRC 2007, Konečný 2010).

Phases of disaster risk management before, during and after a disaster and their objectives (based on COVA 2005, DE VILLE DE GOYET 2008, NRC 2007 AND KONEČNÝ 2010).

Fig.2: Phases of disaster risk management before, during and after a disaster and their objectives (based on COVA 2005, DE VILLE DE GOYET 2008, NRC 2007 AND KONEČNÝ 2010).

The importance of geospatial data is getting more and more obvious as it links any given information to a location. Coordination, navigation and distribution – most information needed during a disaster is geospatial. GPS allows to track people and emergency supply or to position input information from other sensors. High resolution remote sensing data can be evaluated to assess damage and destruction of pathways. GIS-Programs offer the opportunity to connect all the given information in a map and thus support decision-making (Cova 2005, Manfré et al. 2012, Kawasaki et al. 2013).

In sum disaster risk management offers a guideline to cope with the complexity and unpredictability of disasters based on modern communication- and geographic information systems like GIS, remote sensing and Global Navigation Satellite Systems (e.g. Global Positioning System GPS). It is a tool to support decision-making by collecting all the available information and creating a network (Kawasaki et al. 2013, Cova 2005).

But this is just the beginning – future challenges have to be solved to improve disaster risk management. The goal is to develop an open, fast, flexible, transparent and standardized data sharing system so information can be located quickly and by everyone. As OpenStreetMap and other Webmapping services evolve everyone gets the opportunity to be part of the solution.

After all some questions for discussion and future blogposts remain:

- Disasters are complex and sudden – is disaster risk management the right way to deal with such situations?

- Which negative aspects can result from this large-scale and open data-sharing?

- What about places without broad internet access and large numbers of mobile phones? Who will provide the necessary information-input?

- What about data quality?

Literature:

Cova, T. J. (2005). GIS in emergency management. In P. A. Longley, M. F. Goodchild, D. J. Maguire, & D. W. Rhind (Eds.), Geographical Information Systems: Principles, Techniques, Management and Applications (2nd Editio., pp. 845–858). Wiley.

De Ville de Goyet, C. (2008): 2 Information Gaps in Relief, Recovery and Reconstruction in the Aftermath of Natural disasters. In: Amin, S., & Goldstein, M. (Eds.). (2008). Data against Natural Disasters. The World Bank.

Kawasaki, A., Berman, M. L., & Guan, W. (2013). The growing role of web-based geospatial technology in disaster response and support. Disasters, 37(2), 201–21. doi:10.1111/j.1467-7717.2012.01302.x

Konečný, M., & Reinhardt, W. (2010). Early warning and disaster management: the importance of geographic information (Part A). International Journal of Digital Earth, 3(3), 217–220. doi:10.1080/17538947.2010.508884

Manfré, L. a., Hirata, E., Silva, J. B., Shinohara, E. J., Giannotti, M. a., Larocca, A. P. C., & Quintanilha, J. a. (2012). An Analysis of Geospatial Technologies for Risk and Natural Disaster Management. ISPRS International Journal of Geo-Information, 1(3), 166–185. doi:10.3390/ijgi1020166

NRC. National Research Council (2007). Improving Disaster Management: The Role of IT in Mitigation, Preparedness, Response, and Recovery (p. 192). National Academies Press. Chapters 1 and 2.

Online-support of recent disaster (Ebola-epidemic):

http://hot.openstreetmap.org/get-involved

http://umap.openstreetmap.fr/en/map/ebola-e-tracking-in-sierra-leone-liberia-and-guine_12522#7/6.222/-7.317

Welcome

Welcome to the course “Disaster Mapping 2.0: Volunteered Geographic Information in Disaster Risk Management and Humanitarian Aid” offered in the Winter Semester 2014/2015 by Prof. João Porto de Albuquerque and Svend-Jonas Schellhorn of the GIScience group of the Institute of Geography at Heidelberg University. In the next following weeks until the end of November 2015 we will discuss the topic with invited blogposts from students, we look forward to your contributions!

« Newer Posts